
Every industry sector faces risks, but not every business knows how well it’s managing them. That’s why health and safety benchmarking matters.
It gives your organization a clear way to measure its safety performance, compare results with other organizations, and spot gaps before they turn into real problems. More than a checklist, it’s a way to see where you stand, what needs work, and how to move forward with data you can trust.
In this article, you’ll learn what health and safety benchmarking is, why it’s a smart move for any industry, and how it can help your team build a safer workplace by tracking what truly matters.
What is Health and Safety Benchmarking?
Companies use health and safety benchmarking to measure how their safety performance compares with others in the same industry sector. The goal is not just to gather numbers but to use the results to make meaningful improvements.
Each year, around 2.6 million nonfatal workplace injuries occur in the United States. That number shows the need for better comparison and progress tracking.
Many organizations take part in an annual safety survey where they submit safety performance data such as incidents, inspections, training, and hours worked. These results go into a safety benchmarking report and often become part of a shared safety benchmarking portal.
Leaders use this information to spot performance gaps. For example, a firm in the construction industry sector may find that its incident rate is 20% above the industry average. That difference points to a clear need for change. Reviewing proven safety rate data gives teams a fair, realistic baseline.
Comparing quantitative data helps safety managers improve decision quality and improve safety performance. When a company sees how it stacks up, it can act with more clarity. Benchmarking supports better tracking, smarter goals, and safer outcomes.
Why Health and Safety Benchmarking Matters for Every Industry Sector
Health and safety benchmarking helps leaders find out if efforts are working or falling short. Comparing results across similar businesses gives each organization a clearer sense of its strengths and problems.
When you understand how your organization compares to others, you can focus on specific goals, not just general safety ideas. Benchmarking also supports smarter planning and helps track results with real accuracy.
Key reasons to use benchmarking include:
- Prevent incidents through better reporting and analysis
- Reduce accidents by addressing weak points in current practices
- Achieve zero injuries by acting on what the data shows
- Track safety incidents and trends that increase workplace harm
- Apply a solid safety system that works across all departments
- Improve compliance by aligning with proven standards
- Support risk assessment using real outcomes, not guesswork
- Cut aid cases by fixing recurring hazards
- Reduce costs related to downtime, claims, and legal issues
- Maintain cost effectiveness by working with clear priorities
- Gain a competitive advantage through strong safety performance
- Use continuous benchmarking to build lasting progress
- Understand the leading causes of injury in your sector
- Monitor ill health patterns before they grow worse
- Keep continuously measuring outcomes to adjust plans
Types of Corporate Safety Performance Benchmarks
Companies use different types of benchmarks to measure safety. Some focus on results, others on routines. Both help identify problems and support better decisions.
Performance Benchmarking
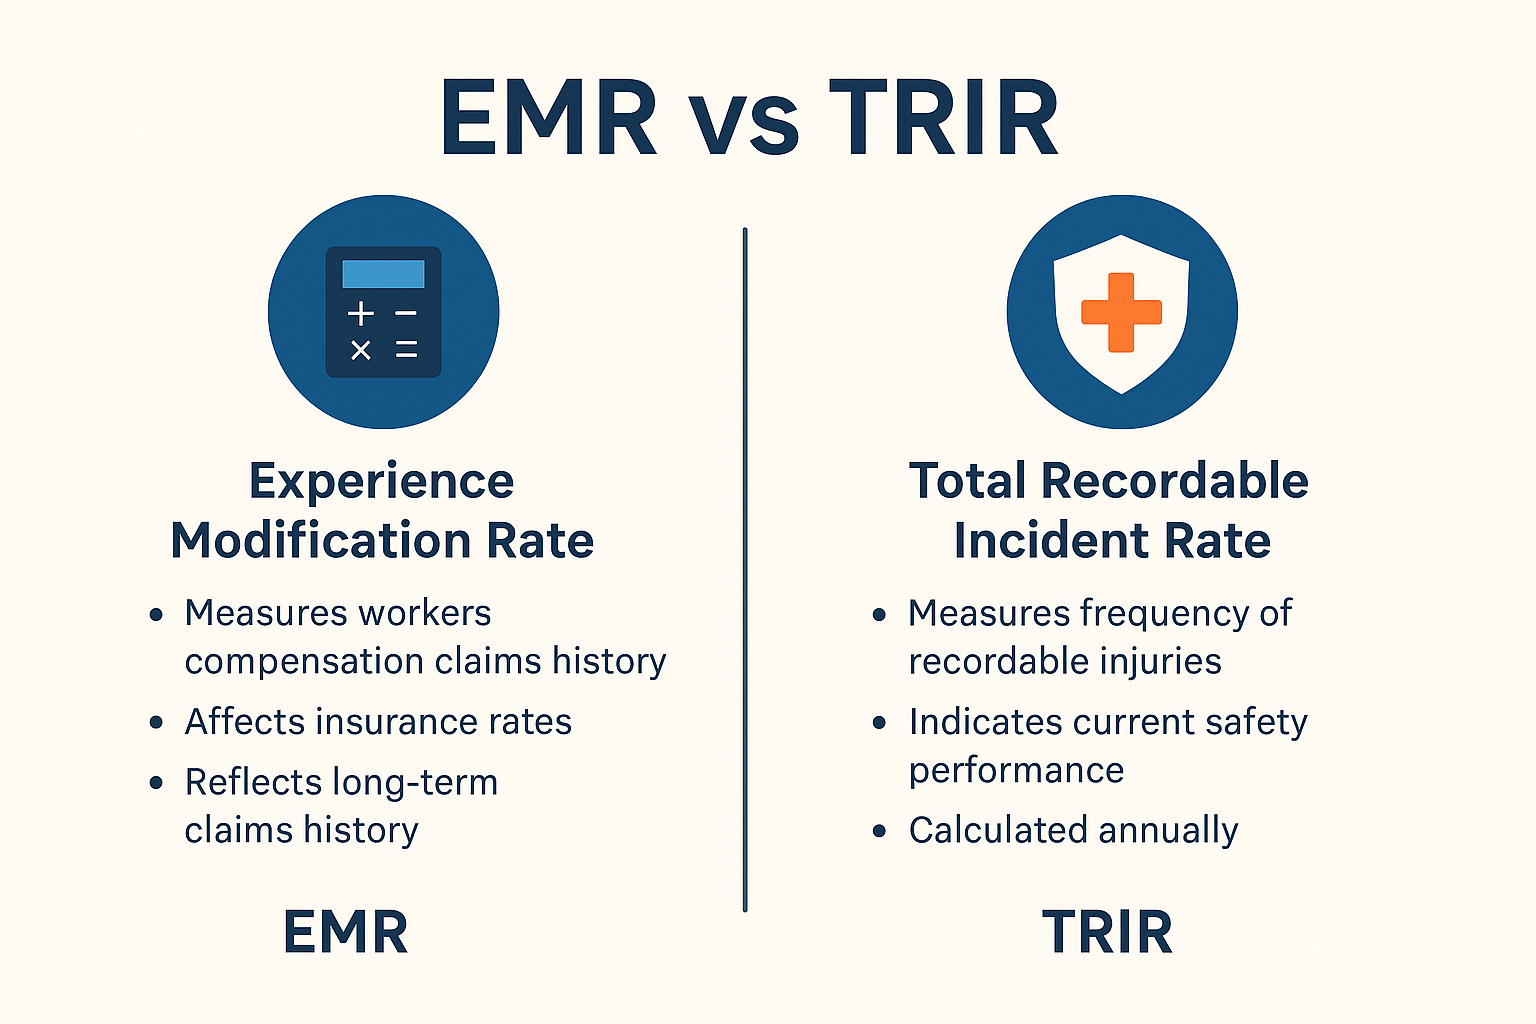
Performance benchmarking focuses on measurable safety outcomes. Companies track data such as the total recordable incident rate (TRIR), days away, restricted or transferred (DART), and lost workdays.
In 2023, U.S. private industry reported a TRIR of 2.4, according to the Bureau of Labor Statistics. A business with a TRIR above this level may need to adjust training or procedures.
Collecting safety performance data helps teams find performance gaps. Comparing incident frequency, audit completion, and training participation gives clear insight.
In the construction industry sector, common metrics include fall protection compliance and near-miss reporting. Companies use this quantitative data to measure trends and improve compliance.
Practice Benchmarking
Practice benchmarking focuses on how tasks are performed, not just the results. Safety leaders study how other organizations manage inspections, conduct behavior-based observations, and deliver safety talks.
Using strong practices cuts unnecessary risks. Looking at documented routines helps teams spot weak areas and build habits that support ongoing improvement.
Internal Benchmarking
Internal benchmarking compares one department, job site, or team to another inside the same organization.
A regional office might complete 95% of safety training on time, while another office completes only 70%. This information pushes leaders to act quickly and shift successful methods across the company.
Strong internal comparisons create a shared perspective on what good safety looks like. High-performing teams often set the standard for others. Reviewing internal results encourages real-time corrections without waiting for outside feedback.
External Benchmarking
External benchmarking compares a company’s results with those of others in the same field. Public sources like OSHA, the BLS, or an industry safety benchmarking portal provide reports on incident rates, inspection scores, and hazard control trends.
Companies with low incident rates use continuous benchmarking to prove progress. A business that tracks against public targets such as zero injuries or a lower DART score can back its safety claims with evidence.
In many industries, external comparisons support funding, insurance reviews, and contract bids.
How to Start Occupational Health and Safety Benchmarking in Your Organization
Benchmarking process works best when the plan starts with clear steps and follows a consistent structure. Treating it as an ongoing process helps teams build a strong track record and keep results meaningful over time.
Identify Relevant Industry Benchmarks
Start by selecting data sources that match your business type and scale. The latest safety rates published by OSHA and BLS include TRIR, DART, and injury totals by employee type. Organizations like CURT also share construction-specific benchmarks.
Use sources that provide:
- Survey results from national databases, industry groups, or third-party platforms
- Records that show counts of first aid cases and lost-time injuries
- Reports where the survey includes questions on training, inspections, and incident response
- Platforms that ensure confidentiality for shared submissions
A comparison with one organization in your sector can clarify how far ahead or behind your team stands.
Set Measurable Safety Goals
Use benchmarks to create clear targets. Define key performance indicators such as:
- Number of safety audits completed per quarter
- Total near-miss reports submitted
- Total hours worked without a recordable injury
- Monthly reports of first aid cases
Many companies follow two paths. Some aim to meet average sector scores, while others choose to exceed them. Both options require a planned process that supports steady progress.
Collect and Analyze Safety Data
Gather information from across the organization, including inspections, hazard observations, and training records. Companies that study patterns, not isolated events, make faster corrections.
Focus on:
- Incident types by site or department
- Recurring issues that slow down inspections
- Audit results by team or shift
- Events linked to known potential causes of injury
Clean data improves decision-making and supports faster action.
Compare and Adjust
Compare your results with external benchmarks to see where updates are needed. The average DART rate for private industry in 2022 stood at 1.7. A higher rate signals problems in training, supervision, or hazard control.
Use this data to adjust procedures, reassign tasks, or shift inspection focus. Teams that check performance against real standards fix weak points faster and build stronger safety habits.
Confidently Benchmark Safety Metrics That Matter With EHS Momentum

Accurate benchmarking depends on consistent data, fast reporting, and easy access. EHS Momentum gives teams the tools to track what matters and compare safety results across sites, shifts, and time.
Their MyMomentum platform helps you:
- Track audits, training, inspections, and incidents in one place
- Assign and monitor corrective actions with deadlines
- Use QR codes for quick inspections and real-time updates
- Store OSHA logs, safety records, and reports for fast access
- View dashboards that show progress and reveal weak points
Every feature supports the full benchmarking process. Leaders make decisions based on facts, not estimates. Field teams use the tool without delays or extra steps.
One missed inspection can lead to serious setbacks.
FAQs About Safety Benchmarking
What is safety benchmarking?
Safety benchmarking compares a company’s health and safety performance to other organizations, helping teams identify performance gaps and adjust their processes to ensure compliance with industry standards.
What are benchmarking examples?
Examples include comparing lost-time injury rates, first aid cases, or audit completion across job sites, departments, or with peer companies like CURT members in the construction industry.
What is the HSE benchmarking tool?
The HSE benchmarking tool is a system or software that tracks and analyzes safety performance data to help businesses measure progress, compare outcomes, and improve their overall safety programs.
What is the KPI for safety?
A KPI for safety is a measurable indicator, such as total recordable incident rate (TRIR), near-miss reports, or safety training completion rate, that reflects the effectiveness of a company’s health and safety efforts.